Animating history transitions
Jun 01, 2018 — Tags: The editor
Over the past few weeks I’ve been working on a way to visualize the relationships between histories of different part of the program structure. The results are shown in the below.
In Expressions of Change we take modifications to programs to be the primary building block of program construction. We do this in the expectation that that the availability of well-structured historic information across our toolchain will prove invaluable when facing the typical challenges of program modification.
One of the first such benefits is the ability to inspect history at any level of program granularity as it pertains to that level. That is: if a program consists of e.g. modules, classes, functions, statements and expressions, to be able to inspect the history of each of these, and to see how these histories relate.
Over the past few weeks I’ve been working on a way to visualize this central idea, under the working titles of “animations” or “transitions”. Here you can see it in action:
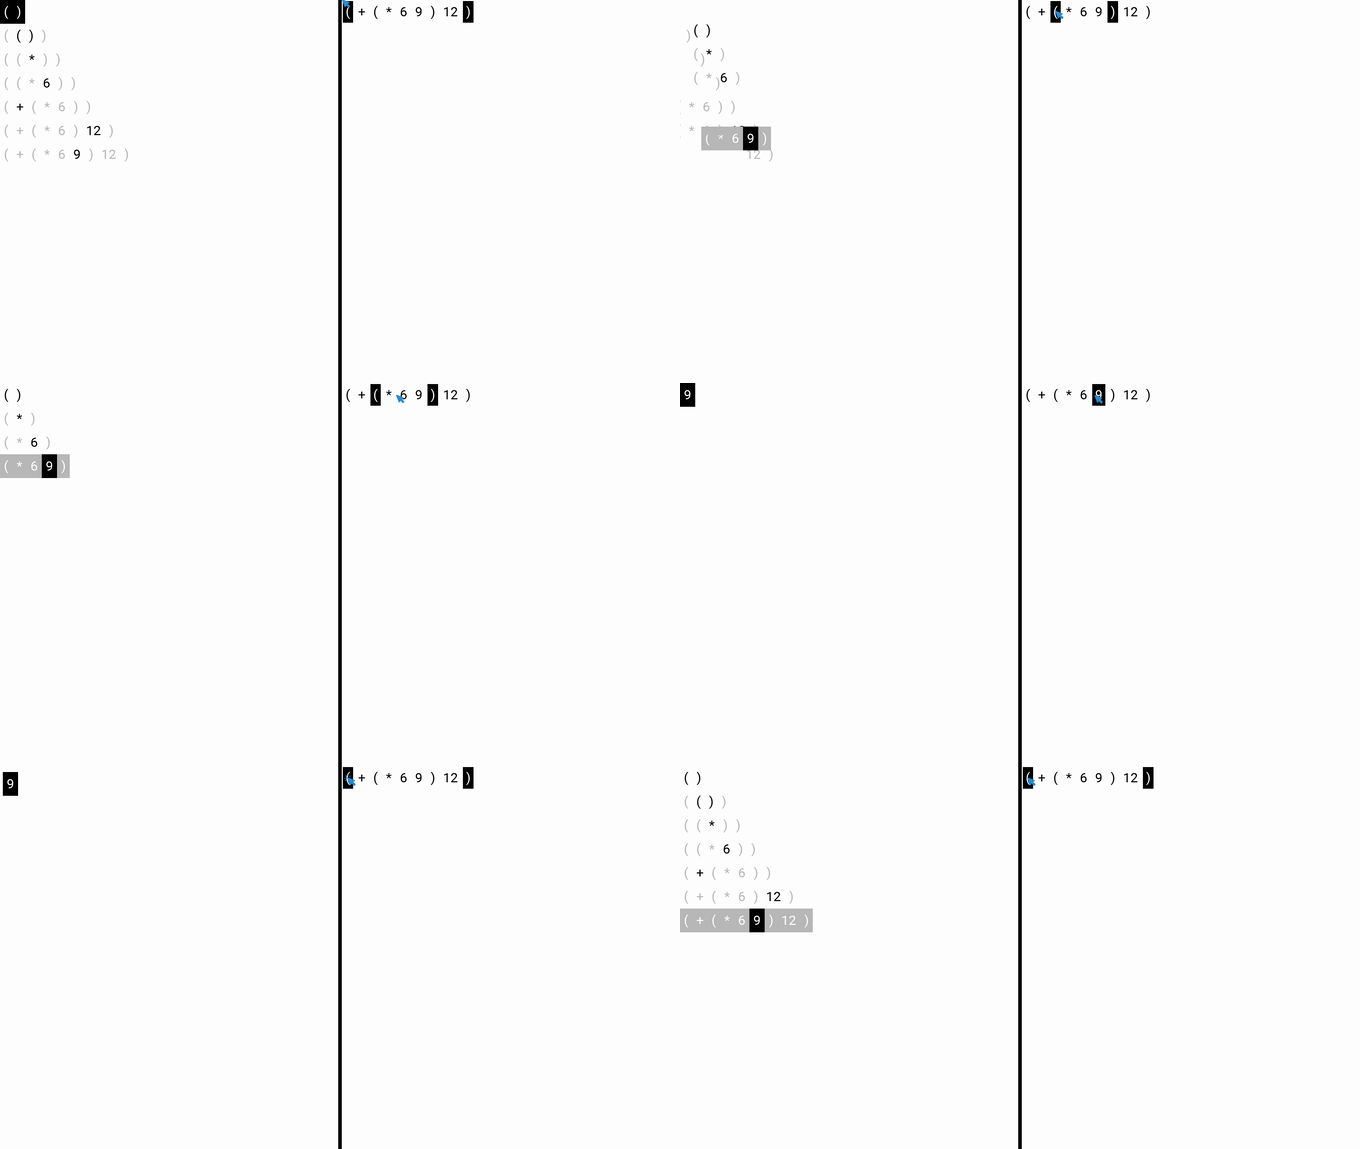
How should we understand the two panels shown above? The panel on the right represents program structure, i.e. what we usually think of as “the program”. The structure under consideration is an s-expression, recursively defined as either a list-expression of further s-expressions between parentheses ( and ), or an atom.
The panel on the left represents a historic overview of the program’s construction: something we usually think of as “Version Management”, although in Expressions of Change we avoid that term, because we view the history of the program as at least equally as important as the program itself.
In the above, the representation of construction is “in its structural context”. That is: each line shows how a certain modification affects the existing structure: parts of the structure that already existed before the modification are shown in grey, parts that are added by the modification are shown in black.1 (Deletions would be shown in red, but the example above contains no deletions). The single line with inverted colors denotes the cursor in the historic view.
Importantly, the two panels are connected: whenever we select some
In the above, we select the expression (+ (* 6 9) 12), its sub-expression (* 6 9)) and the atom 9 respectively, each time showing the relevant histories.
Animations / transitions
The innovation from the past few weeks is that, whenever we switch between the display of one history and another, we show the relationship between the two using an animation.
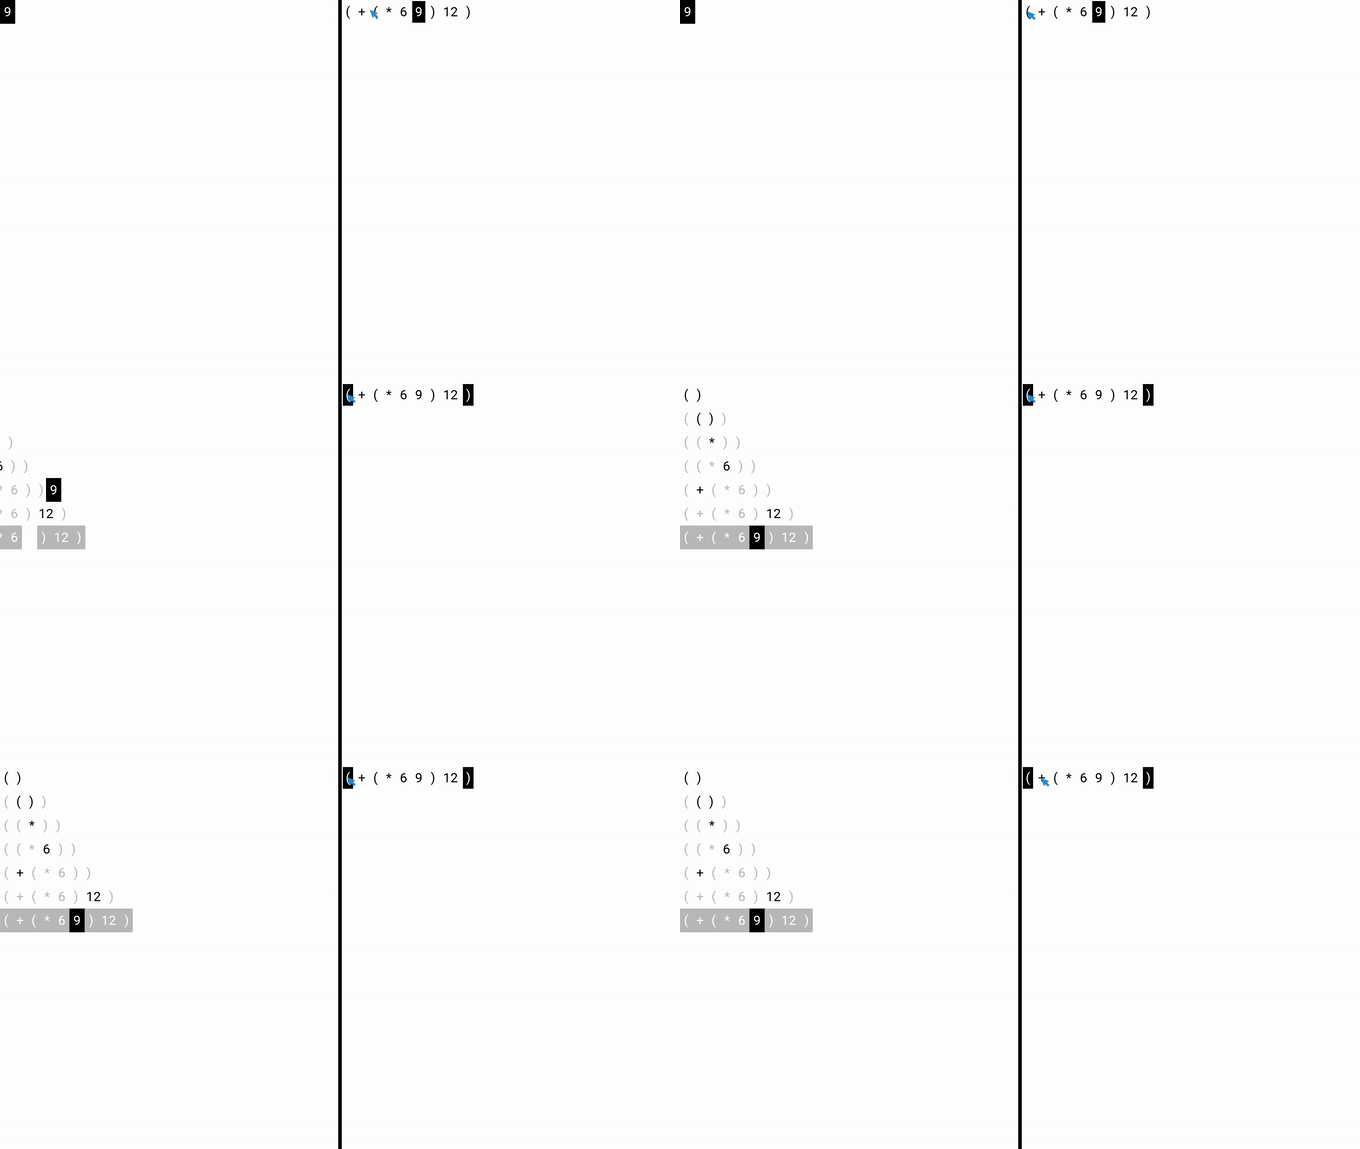
The simplest example of such a relationship is the one between the history of the atom 9 (a trivial history, consisting only of its creation) and the history of the whole expression (+ (* 6 9) 12). When we switch from the former to the latter, we see two additional types of information: first, we see that the creation of the 9 is preceded by the construction of the rest of the expression beginning with the creation of the list () and ending with the addition of the atom 12. Second, we see where it fits into the greater expression, i.e. to the right of the 6 and left of a closing bracket. Here this single transition is singled out:
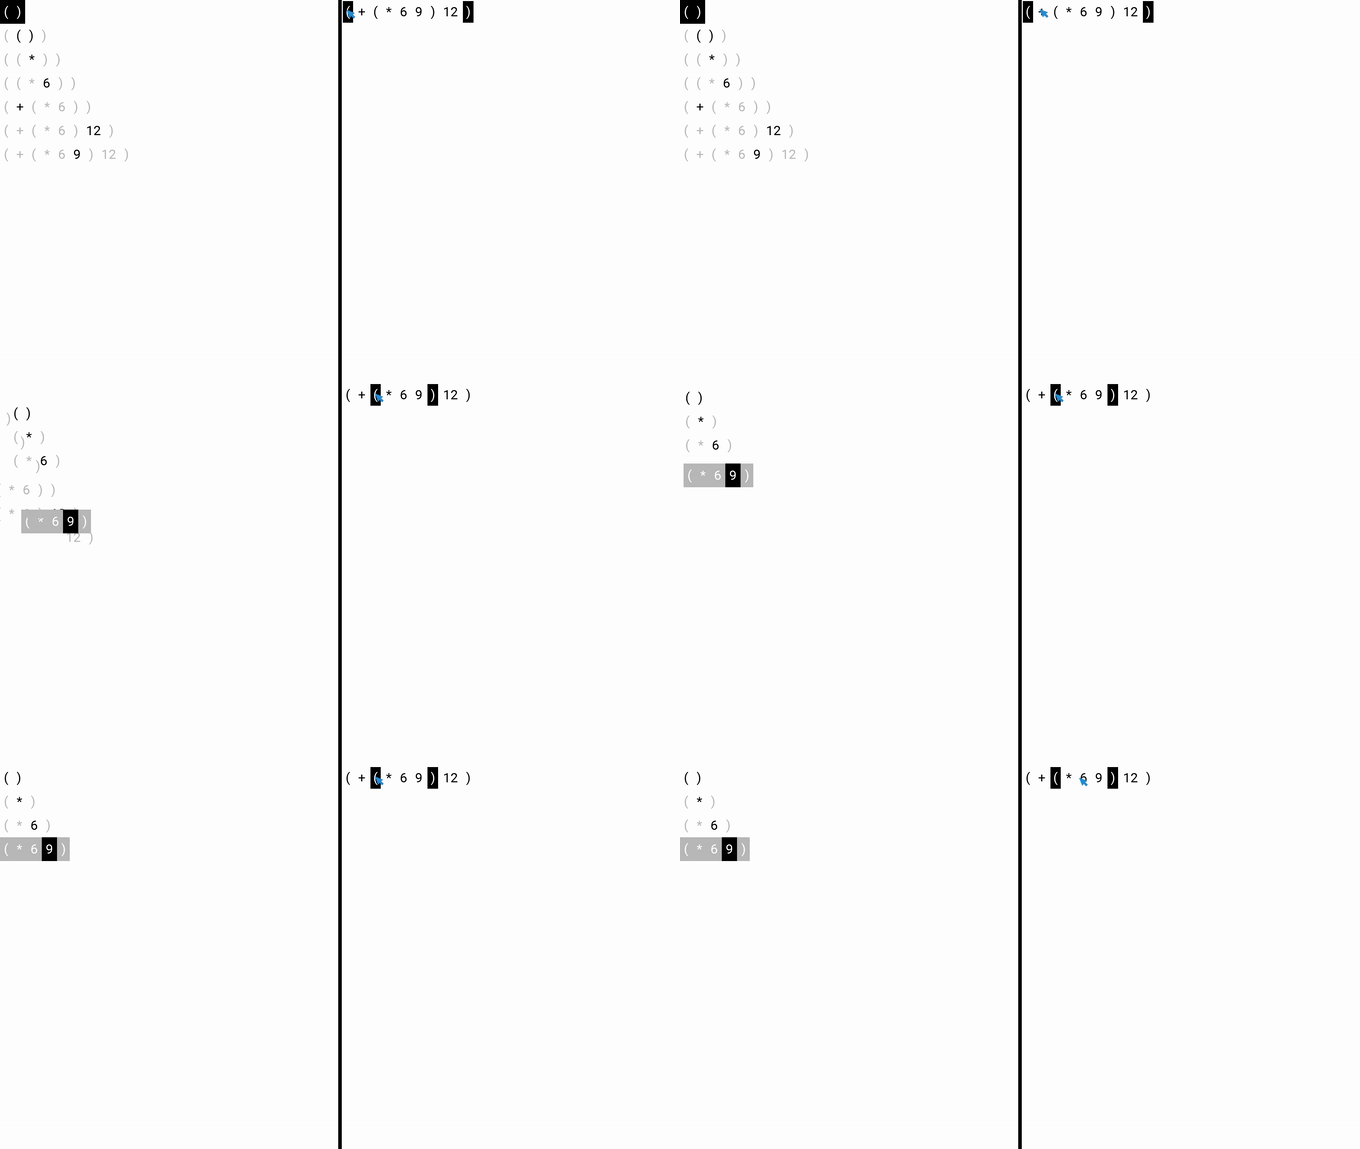
The transition between the histories of (+ (* 6 9) 12) and the sub-expression (* 6 9)) forms a more exiting example: we can see how each of the 4 elements of the latter relate to the history of the former, and how they fit into a larger context. Again, we show only the single transition here:
Why bother?
I believe these animations are useful for two separate reasons. First, when explaining the concepts of Expressions of Change, a (moving) picture says more than a 1000 words. In this case, the point that’s being explained visually is the idea of “history at any level”.
Second, in an editor for actual use, the animations serve as a visual aid: transitioning smoothly from one history to the next really helps you keep your bearings while navigating.
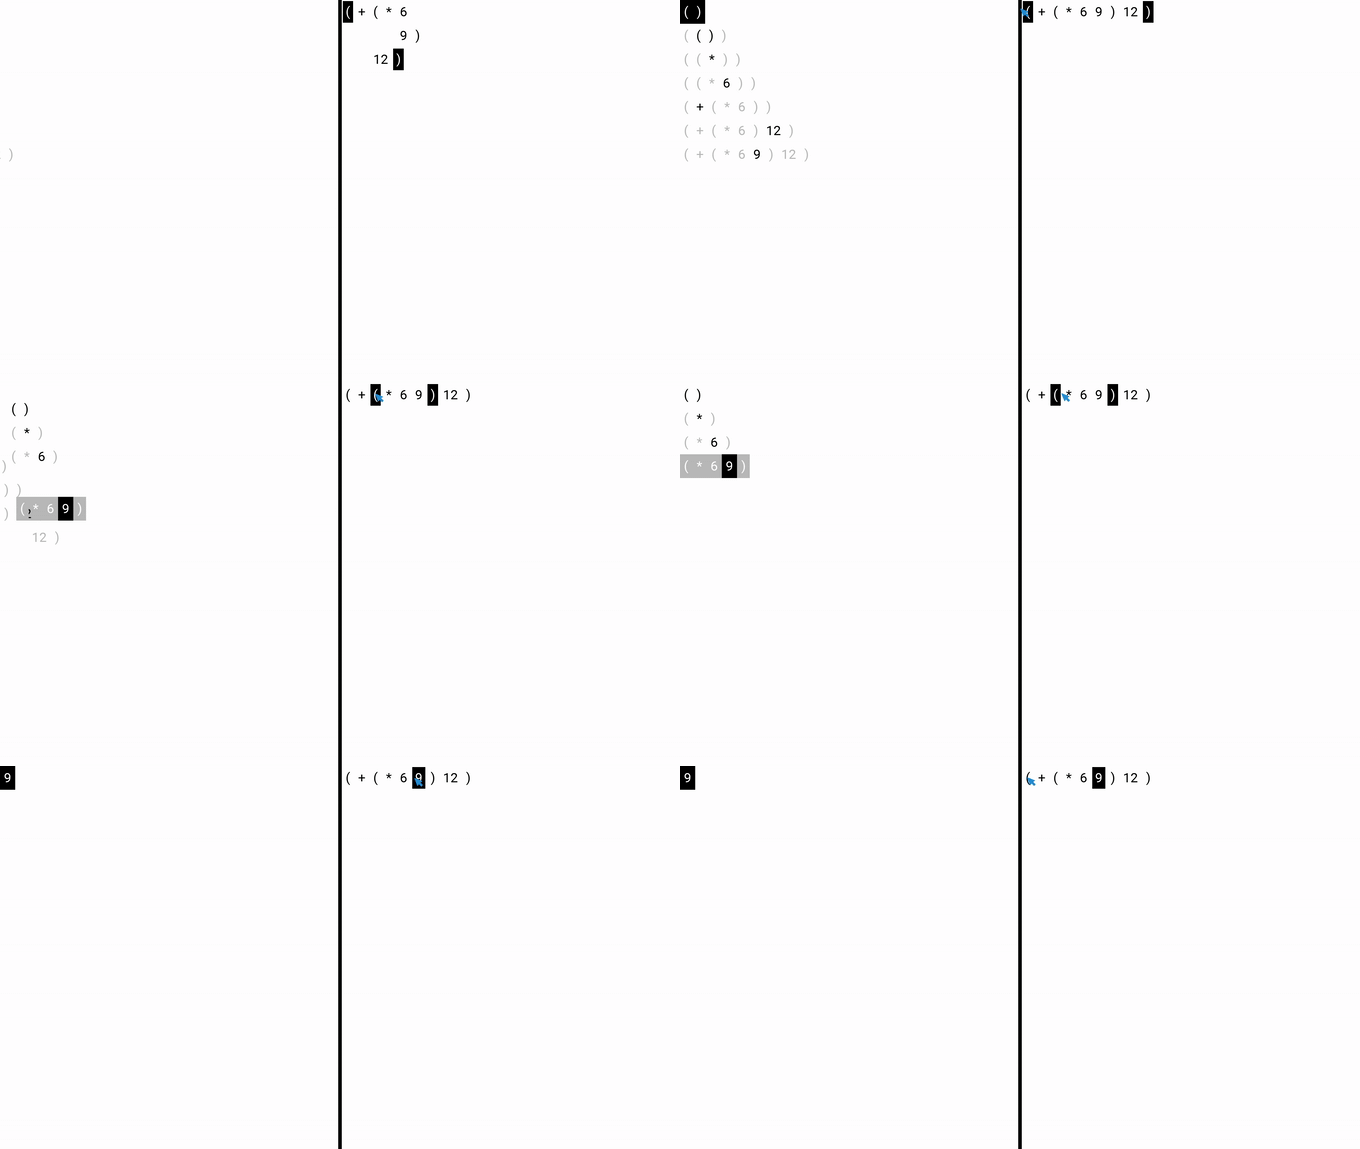
By the way, the animations in the gifs shown in the above are slowed down to a full 1.5 seconds for both dramatic effect and to ease understanding of what’s happening in the context of a blog-post. In an actual edit environment we’ll want to balance between too fast and too slow: the former makes it impossible to see what’s going on, the latter leads to annoying waits. I found personally found 0.5 seconds per animation to be a good trade-off:
“Explicit” notes
The example animations shown in this blog-post correspond directly with the main example from the paper “Clef design”.
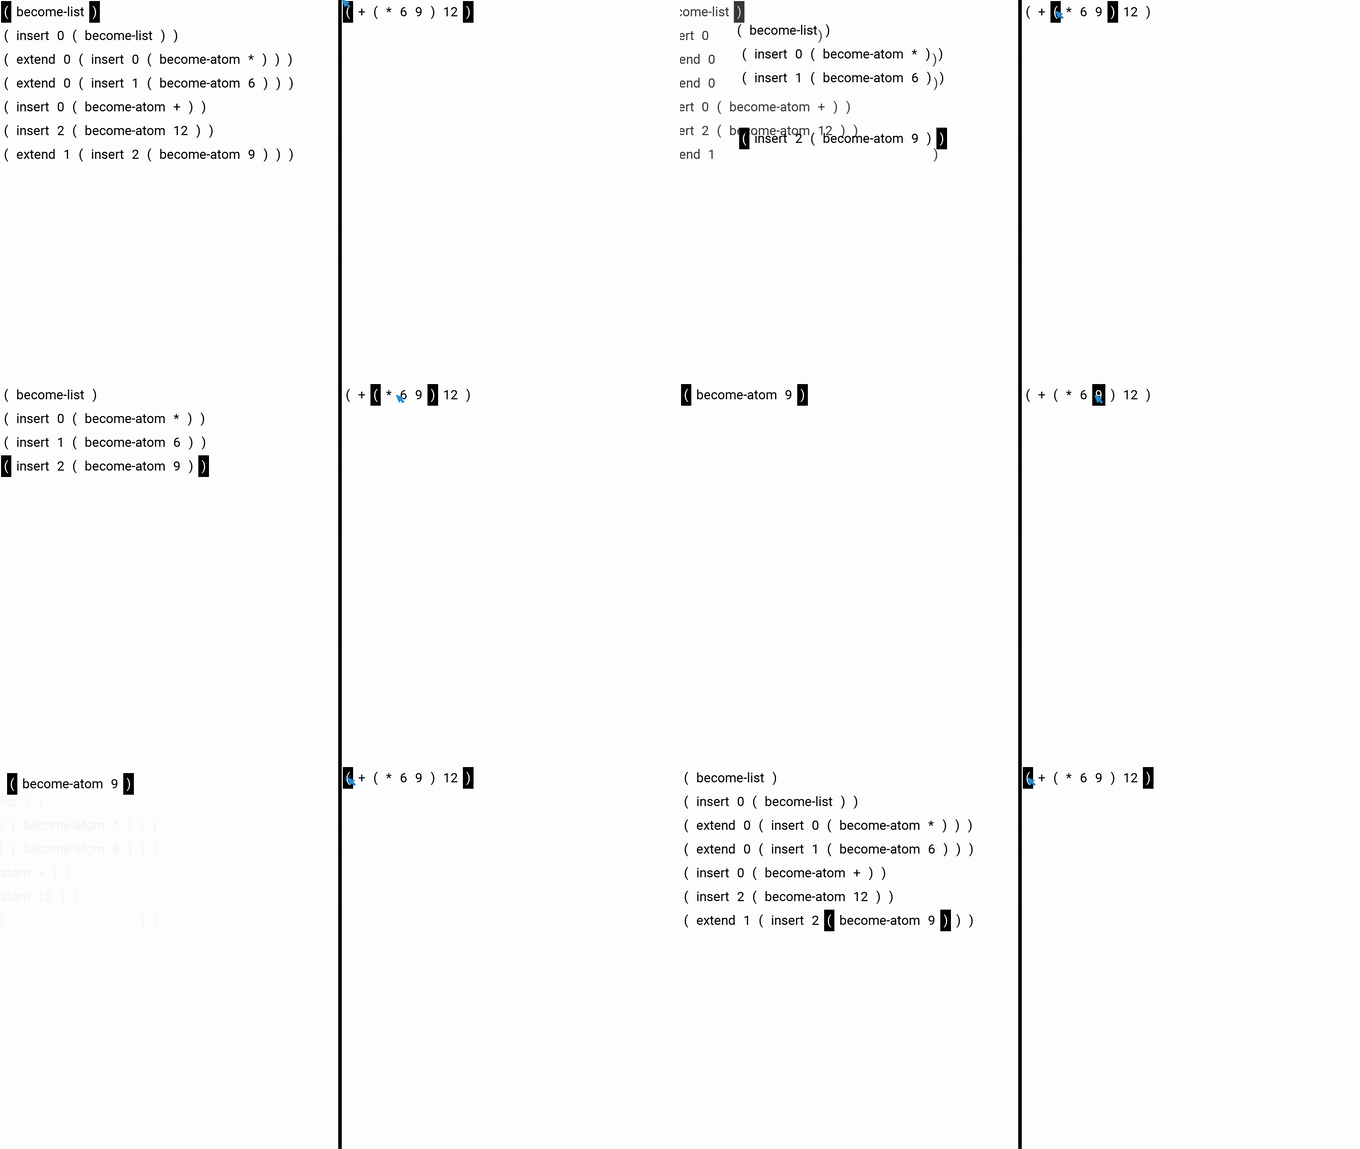
In that paper, we used a more explicit notation for the modifications (called “notes”): those were themselves modelled as s-expressions, rather than displayed by showing how they affect some structure.3
If we apply the ideas of this blog-post to the notation from the paper, it looks like this:
-
One might even be tempted to call this a “diff”, but that would suggest a primacy of structure rather than construction, i.e. it somewhat implies there are two structures first, and we simply calculate the difference. ↩
-
In the above the view of construction always follows the structure’s cursor. In practical situations it’s probably useful to be able to toggle this following of the cursor on or off, retaining the ability to see the history of sub-expressions in their larger context as needed. ↩
-
In fact, the Clef in the demonstrations above differs from the Clef in the paper in one way:
(insert ...and(delete ...taking a single note, rather than a score, as an argument. ↩